APIWatch
APIWatch lets teams register APIs, run manual or scheduled health checks, track uptime and latency, detect failures and rate-limit events, manage incidents, and route notifications through multiple providers.
Role and Contribution
Full-stack project owner responsible for backend architecture, database design, scheduled monitoring, incident workflows, security controls, dashboard implementation, testing, Docker, and CI/CD.
Problem and Context
Teams should not have to manually check API health or piece together failures from scattered logs. APIWatch addresses that reliability gap by combining scheduled monitoring, historical health data, incident detection, alert routing, and an operations dashboard.
Solution Overview
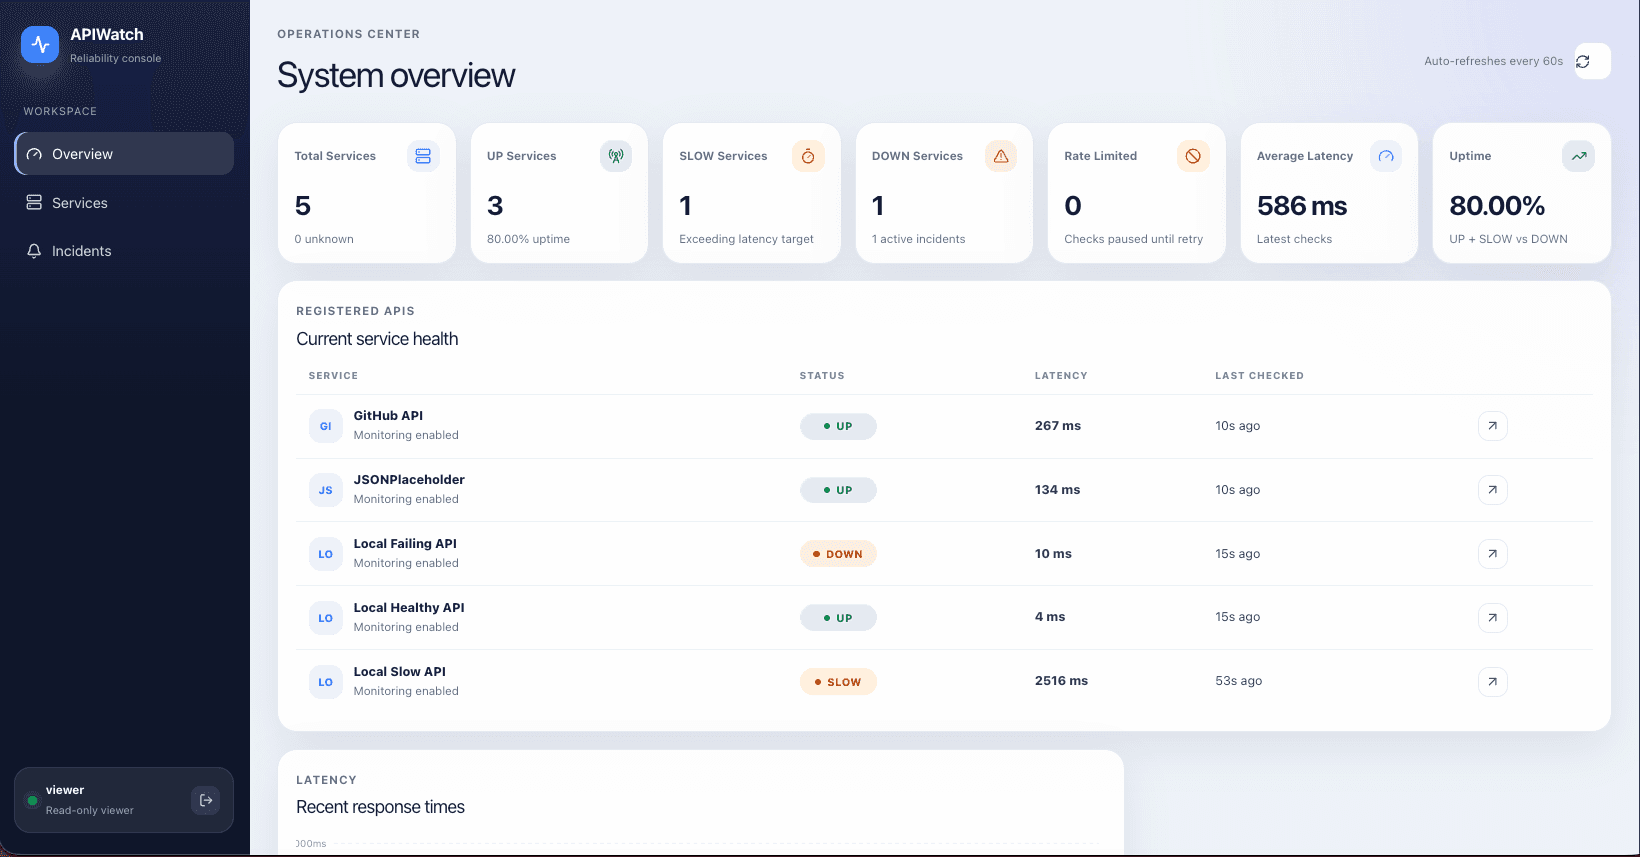
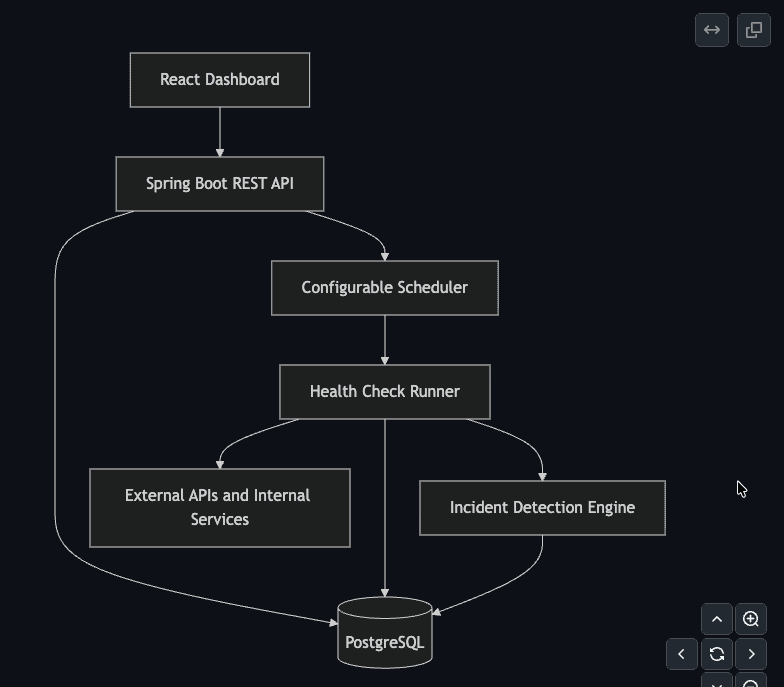
The system uses a Java 21 and Spring Boot 3.5 backend with Spring Security, WebFlux WebClient, Spring Data JPA, Flyway, PostgreSQL 16, and scheduled workers. The React 19 and TypeScript frontend presents service health, latency trends, incident activity, configuration screens, notification settings, and role-aware access.
Interface Screens
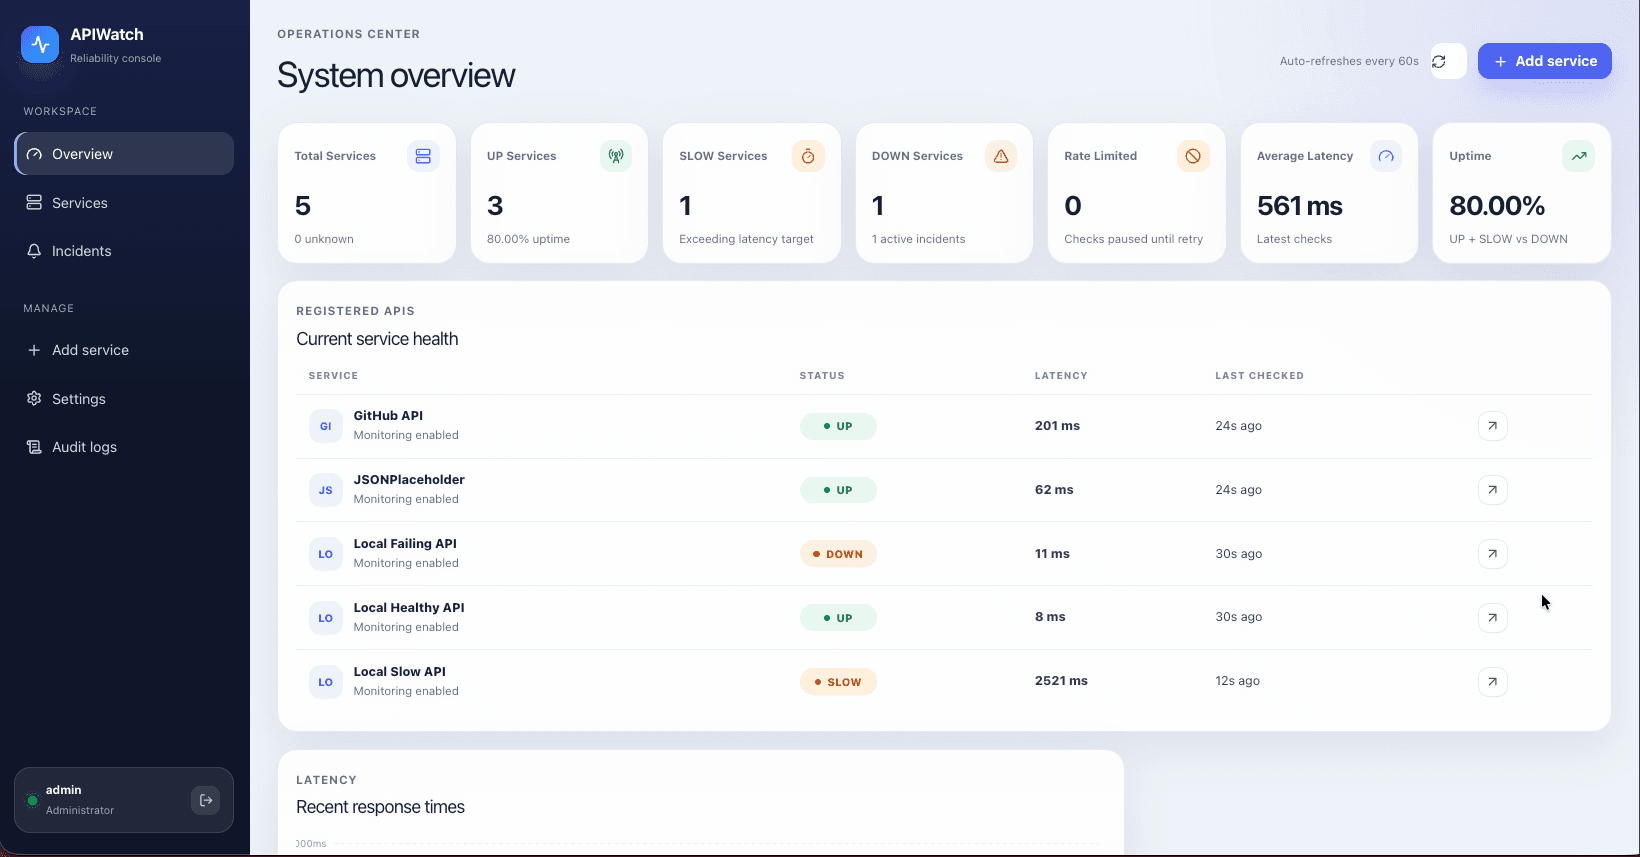
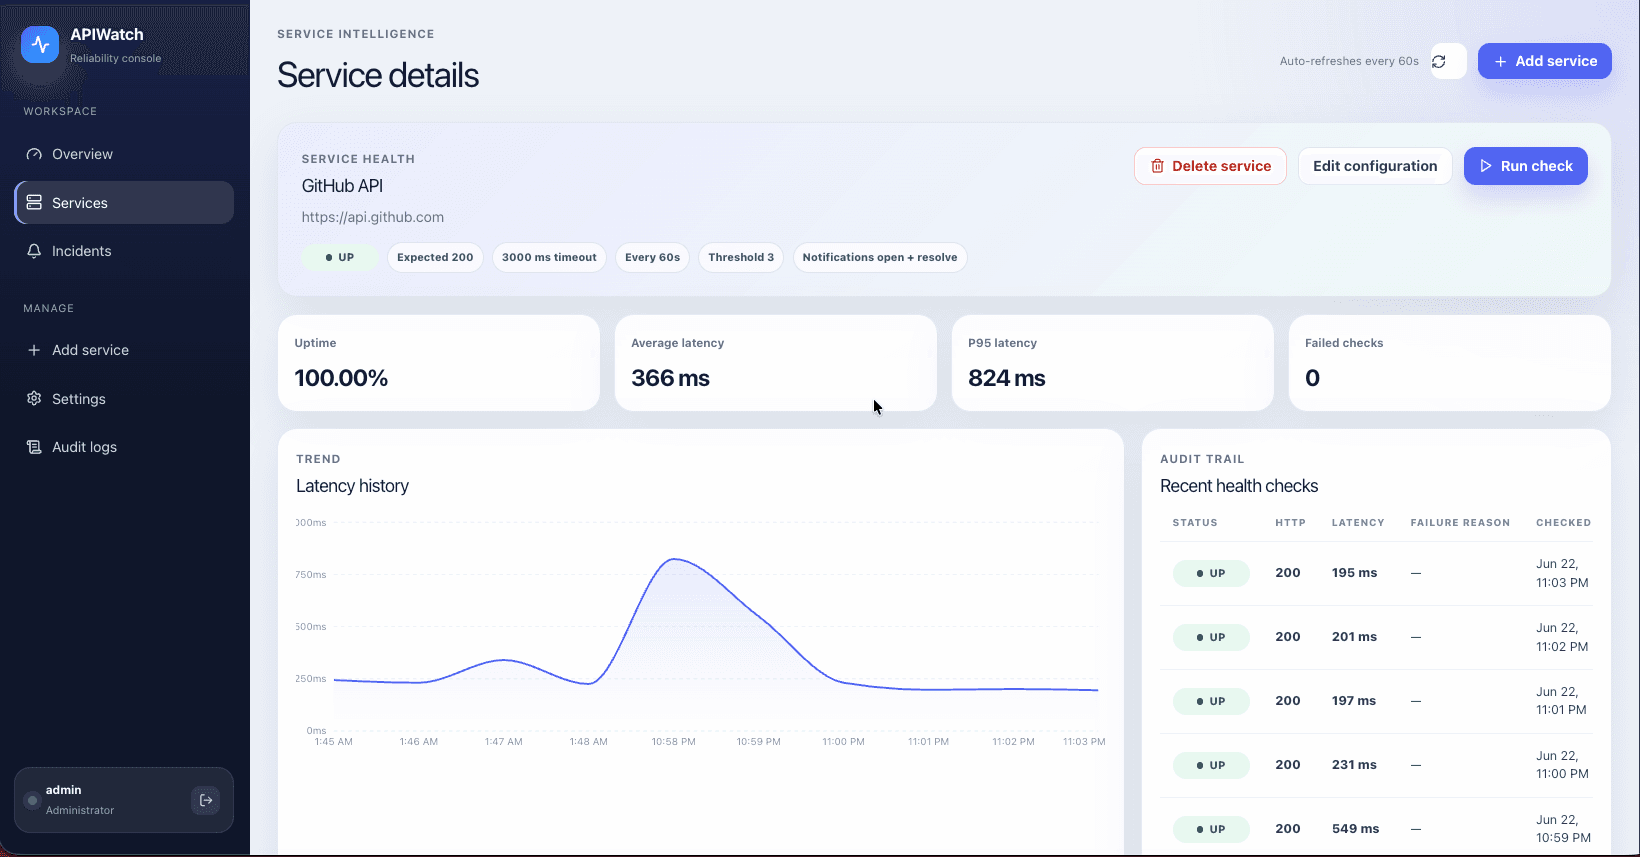
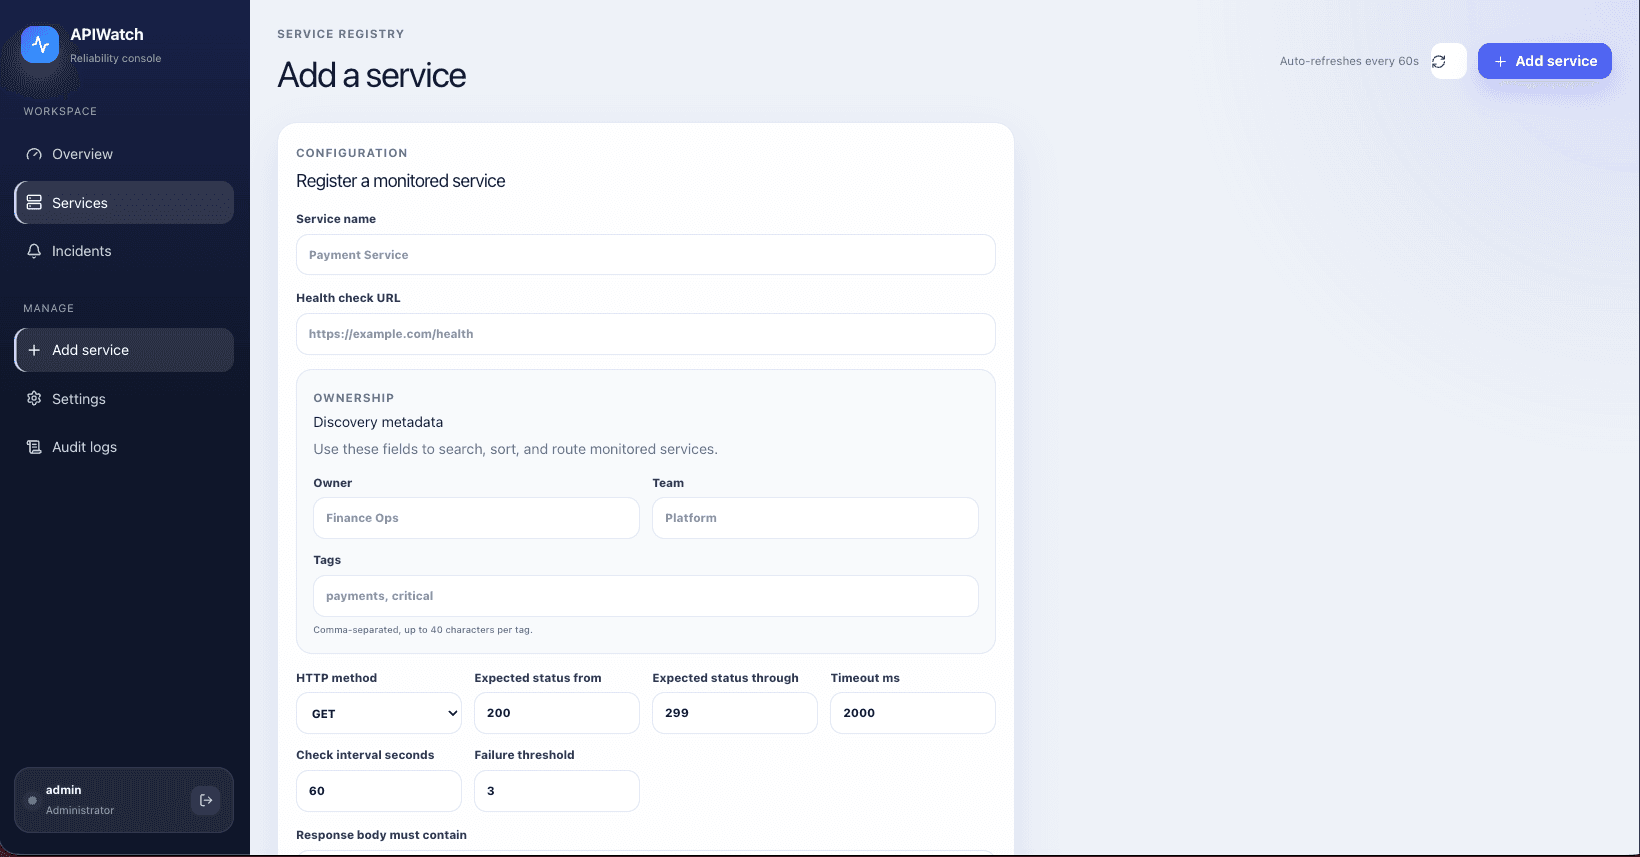
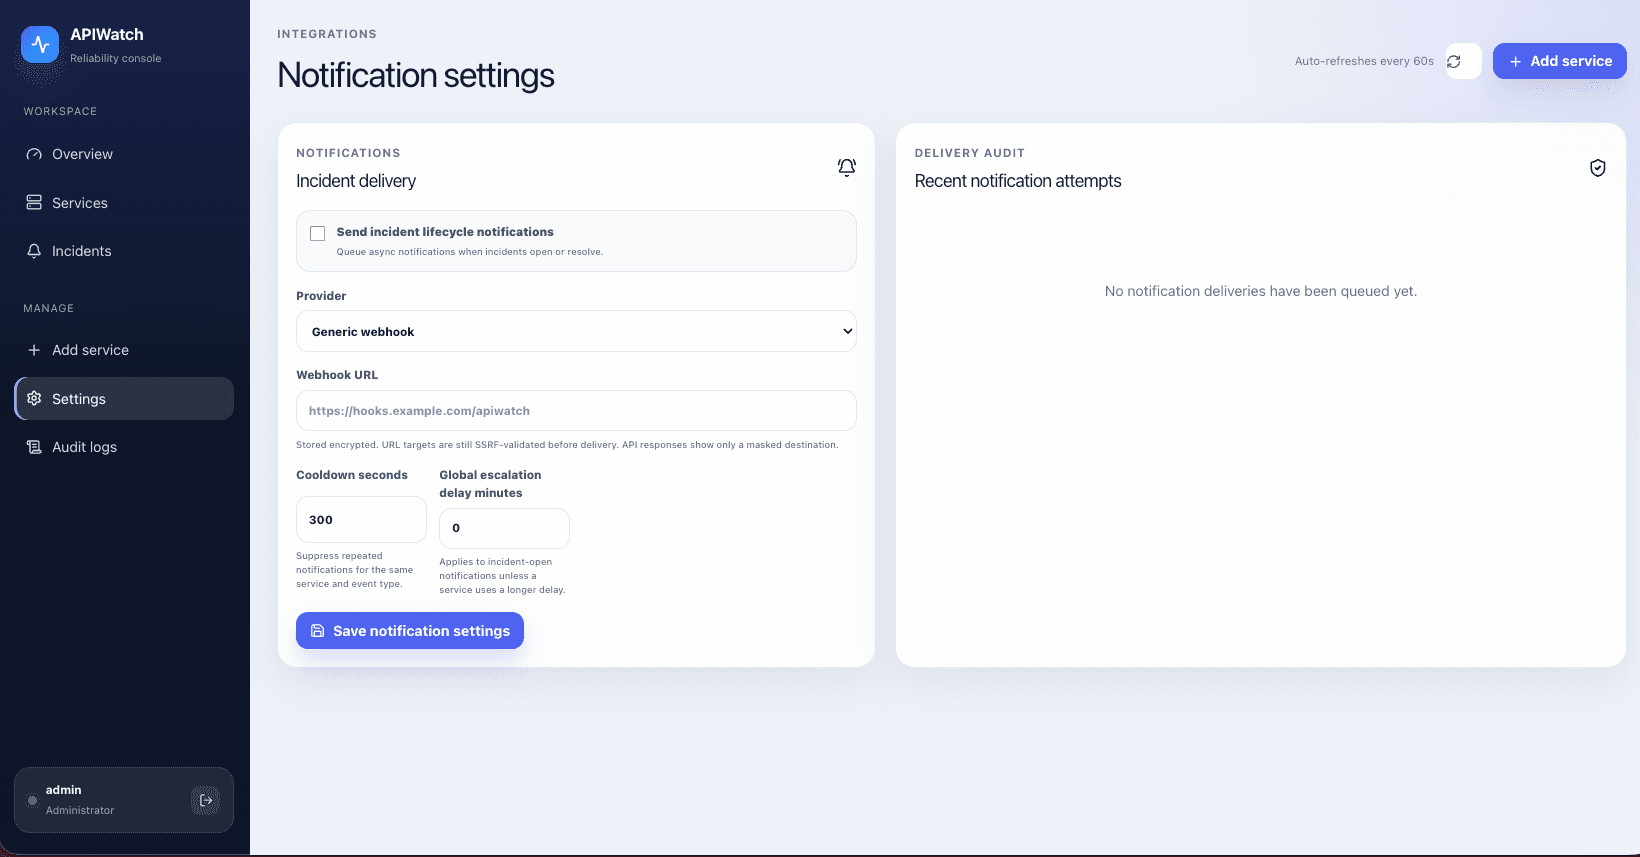
Architecture View
Engineering Decisions
- Model monitored APIs as configurable services with expected status ranges, timeout settings, check intervals, failure thresholds, and optional response-body validation.
- Classify failures into operationally useful states and diagnostics, including DOWN, SLOW, RATE_LIMITED, timeout, DNS, connection, network, and security-block outcomes.
- Use repeated-failure thresholds to create incidents automatically while allowing both automatic and manual resolution when services recover.
- Deliver notifications asynchronously through an outbox with retries, cooldowns, escalation delay, and per-service open/resolve notification rules.
- Protect monitoring targets with SSRF controls, private-network blocking, encrypted secrets, Basic admin/viewer access, and audit logs for administrative actions.
Technical Challenges
- Separating service registration, health-check execution, incident lifecycle handling, notification delivery, and dashboard views without collapsing the system into one large workflow.
- Handling real-world check outcomes such as timeouts, DNS failures, connection errors, rate limits, and security blocks in a way that remains understandable to the operator.
- Balancing security features such as encrypted tokens, custom headers, SSRF protection, and auditability with a usable admin interface.
- Keeping historical checks, incidents, notifications, and audit logs navigable through pagination and retention cleanup.
Outcome and Current Status
Version 1.0 is complete as a portfolio-grade full-stack project. Core feature development is complete across monitoring, incidents, notifications, security controls, responsive dashboard UX, tests, Docker Compose, and GitHub Actions CI/CD.
Lessons and Next Steps
- Deploy the application to a cloud environment with managed database hosting.
- Add production domain, HTTPS, release tagging, and deployment documentation.
- Refresh the README around the mature notification workflow.
- Improve production observability and consider OAuth-based authentication for a later version.